

CoreLogic NZ Head of Research, Nick Goodall said restricted, more expensive credit continued to impact increasingly weary buyers with the property market downturn firmly entrenched and evident across the entire country.
The three-month fall in values of -3.5% is drifting closer to the depths of the Global Financial Crisis (GFC) when the rate of change bottomed out at -4.4% at the end of August 2008.
“Consumer sentiment can be a key influence on the market and with the evidence of market downturn clear in every corner of the country, the already-smaller pool of would-be buyers, due to tighter, more expensive credit, are happy to bide their time in the falling market,” Mr Goodall said.
CoreLogic House Price Index - National and Main Centres
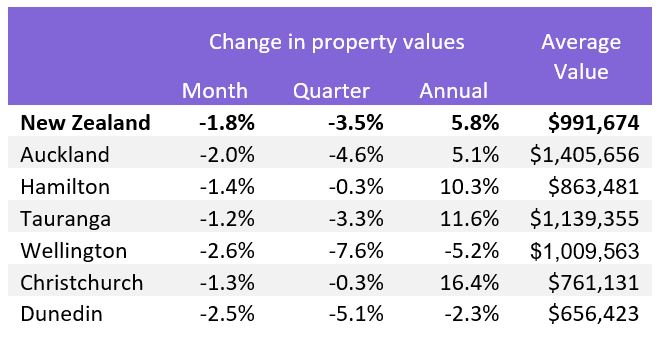
Property values continued to fall across all six main centres in August with Dunedin (-2.5%) and Auckland (-2.0%) joining Wellington (-2.6%) as areas where the monthly rate of change has fallen below -2%.
The monthly rate of decline in the other three main centres was also below -1%, illustrating the broad-based nature of the downturn with the quarterly rate of change dropping into negative territory for all six main centres.
Wellington was the first area to drop into negative territory on the annual measure in July, however August figures show Dunedin and other main urban areas have now joined it.
The three-month percentage fall in Christchurch was very minor and values remain 16.4% above the same time last year, illustrating the greater resilience of the Garden city, which remains the most affordable of the large cities. The property value to income ratio in Christchurch is 7.1 – a lot more favourable than Auckland (9.7) or Dunedin (8.2).
CoreLogic House Price Index – Wellington
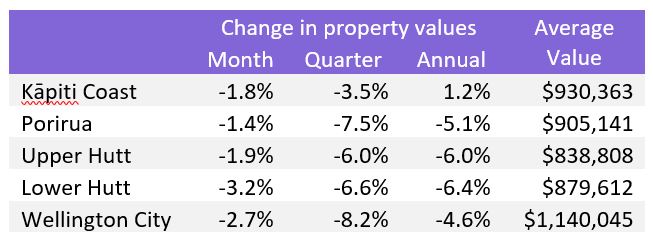
Honing in on the weakness of the broader Wellington area, values fell more than -1.4% in August across each of the council areas, with particular weakness in both Lower Hutt (-3.2%) and Wellington City (-2.7%). The downward momentum in the market has been persistent, with Wellington City values now -8.2% lower than they were at the beginning of winter (1 June).
Of the five areas included here, the Kāpiti Coast District is the only one to have values at a higher level (1.2%) at the end of August than the same time last year, with Lower Hutt property values now -6.4% below then.
“The restrictive lending environment, where loan-to-value ratio limits remain tight and increasing interest rates affect borrowing power alongside waning market confidence, all appear to be consistently impacting this typically high first home buyer market the most,” Mr Goodall noted.
CoreLogic House Price Index – Auckland
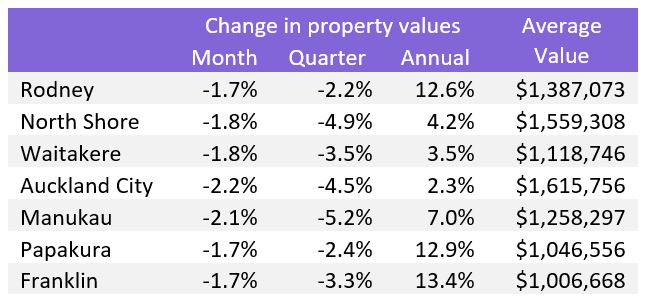
“The downward momentum shift has been relatively consistent across the Auckland Super City in August, with values falling between -1.7% in the city’s outer areas, to -2.2% in Auckland City.
“Longer term change is more varied however, with values only slightly above (2.3%) where they were at the same time last year in the more expensive Auckland City area, when compared to the more affordable locations further south, in Papakura (12.9%) and Franklin (13.4%).”